I was out of town for a chunk of this summer, and when I returned, I had a phone message from the folks at Accordent in response to this post that I did about class-capture vs. screen-capture. I listened to just the openings words of the message to understand that an Accordent rep was calling wanting to help me understand their system better and likely account for what I saw as its deficiencies.
At the moment, I didn't have the time to finish listening to the message and planned to return to it later. Unfortunately, the vagaries of technology and children have conspired to erase the message from my answering machine. I don't know the name of the person who called and I have no contact information for him. However, if you're still reading this blog, feel free to contact me at the same number you reached me at before.
Monday, July 21, 2008
Thursday, June 19, 2008
Goodbye, ECIT
And so, my tenure here in ECIT has drawn to a close. I just wanted to take a moment to publicly thank the three people who have mentored me through the year. Shannon O'Daniel has been a canny resource for discussing iTunes U, web design, and all things Apple. Alan Cattier has been a tremendous support in being always enthused and interested in what I have been doing here. And most of all, Wayne Morse has encouraged me to explore the different tools that ECIT offers, let me follow my nose to the things that interested me most, and given me opportunities to teach various groups here. I've learned a lot about academic computing and how to effectively use various tools this year, but I've also grown from the friendship of Wayne, Alan, and Shannon, as well as the other ECIT grad students. And I'm glad to say that working within timelines was not something I only did while in ECIT: I've also got my dissertation under review by my committee for an August graduation. So the fellowship did exactly what it was supposed to.
This blog will likely cease updating regularly, but I plan on starting a new, more permanent blog presence where I can continue talking about my use of technology in the classroom, as well as reflecting more generally on what I am about. One of the best lessons of the year has been the value of regular writing in this space and the interaction that I have had (online and off) about what I have written. I'll let you know the address when I resurface.
This blog will likely cease updating regularly, but I plan on starting a new, more permanent blog presence where I can continue talking about my use of technology in the classroom, as well as reflecting more generally on what I am about. One of the best lessons of the year has been the value of regular writing in this space and the interaction that I have had (online and off) about what I have written. I'll let you know the address when I resurface.
My New Website, AKA Behold the Power of CSS!
My fellowship here in ECIT recently ended. As I had finished my timeline tutorial in the middle of May (but not yet, I'll concede, the Advanced Customization Page), I was left trying to think about what I could most profitably do here for the remaining days of my employment. I decided that creating a better web presence for myself made a lot of sense. And so I spent a few days looking at other academics' personal websites and thinking about what mine should look like.
ECIT occasionally is asked to teach faculty or students how to write their own web pages. This basically means giving people a crash course in Dreamweaver. And if you've never really spent much time learning anything about HTML, then it really turns into a crash course. Dreamweaver is not intuitive for first-time users and neither is our teaching all of the time. For example, when I was a student in an ECIT class that included some Dreamweaver instruction, a lot of time was spent talking about tables (!?!). One thing that has been exciting about the blog and wiki tools within Blackboard is that they allow students to create media-rich websites within a matter of moments using a very simple WYSIWYG interface. I'm personally not a fan of Blackboard, if only because it all lives behind a passworded interface that students are not inclined to check on a regular basis.
In any case, I have spent a lot of time this year using Dreamweaver for one thing or another, so I didn't have a problem using it to build my website. What I did skip out on, however, was using tables to arrange my website. Instead, I've done the current (and far better) thing and used CSS to compose the page. I started to learn CSS as I customized different aspects of the timelines that I have written this year. But I really caught the vision when someone pointed me to css Zen Garden. This site provides some information about the benefits of using CSS. But then it shows you how powerful CSS can be by using different style sheets for the same page. For example, this page uses all the same information in the Body of the web page but only has different CSS. This Boy Scout-themed one is another favorite, since I'm a fan of 1950s-inspired graphic arts. Browsing this site, you start to get an idea of what you can do with CSS, and it gives you a chance to start looking at how you can write your own style sheets.
Thus inspired, I spent some more time poking around and ended up getting my start using Owen Briggs's classic CSS boxes to help me design my site. I've done a bit of tweaking on the style sheets and have had a lot of fun doing so. Don't worry: every once in a while I remember that I'm supposed to be an English professor-type.
In any case, you can see my new website here. I'd love to hear what you think or if you find anything broken (besides the as-of-now empty pages where my course materials for this Fall will go). I'm still not sold on the yellow, so if you'd like to vote for other options check out the blue or green versions. Only the front page's links and visited links are in different colors here, but you get the idea.
Tuesday, May 27, 2008
Twitter in the classroom
Dave Parry at academhack has a recent and very good post on how to actually set up a classroom of students using Twitter. I'm going to use Twitter in my "Your Digital Life" class this Fall and following these instructions will make it much easier for me to get the students off and running.
In other Twitter-related news, I'd like to point you toward Twistori for some conceptual art made out of tweets and to hashtags.org for information about putting metadata in your tweets.
For Twitter alternatives, in case I haven't mentioned them previously, check out Pownce, Jaiku, or FriendFeed. The last is an attempt to aggregate all of a person's social networks into one spot. I've set it up so people watching me in FriendFeed can see my activity at Twitter, Blogger, Flickr, del.iciou.us, and more.
Class Capture vs. Screen Capture
Over the winter break this year, ECIT purchased and installed an Accordent Capture Station in one of our classrooms. The desire was to have a space in which video presentations can be easily captured as we move toward pushing more and more stuff to iTunes U for the public release this fall. The classroom now has two smartboards, a remote control camera, wireless mic, a Crestron control system, and a stack of computers and receivers.
When in class capture mode, one of the smart boards turns off, but the Accordent system captures everything that happens on the other board at approximately one frame per second. Simultaneously, it fires up the camera and starts recording video (30 fps). The resulting presentation, which is viewable in Real, has two screens: the smart board and the video of, presumably, you or the class. This is nice because it allows those watching a presentation to see not only the documents, spreadsheets, or PowerPoint/Keynote presentation but also the speaker's facial expressions, hand motions, etc. You get a better sense of what it might be like to watch such a presentation in real-life. What's more, we now have a dedicated space made for video capture so faculty at Emory no longer have to worry about getting a video camera taken to their classroom. The headaches saved by this feature alone probably make it worth thinking about using.
In order to test the system and think about its capabilities, I recently had the chance to record a med school lecture on the heart in the space. Even better, this last Friday I spent an afternoon filming my own presentation on--you guessed it--timelines. Essentially, I discuss the basic features of the interactive timelines I've been playing with this year and demonstrate how easy it is to add information to such a timeline within Google Docs. You can watch the presentation here.
Now, it just so happened that I recorded a presentation on timelines that was more or less identical to this one I made for my Timeline Tutorial using Camtasia. Having already made one presentation was helpful in the sense that I more or less knew what I wanted to say when I got put in front of a camera. More importantly, it gave me the chance to think about the relative advantages and disadvantages of both systems.
And there are plenty of disadvantages to the Accordent class capture system.
Of course, the Accordent is a new tool. We're still trying to figure out how to best use it, what sorts of presentations play nice in the space, and how to get faculty and grad students to make use of it. Still, the gauntlet has been thrown and for the moment, I know which way I'm leaning.
When in class capture mode, one of the smart boards turns off, but the Accordent system captures everything that happens on the other board at approximately one frame per second. Simultaneously, it fires up the camera and starts recording video (30 fps). The resulting presentation, which is viewable in Real, has two screens: the smart board and the video of, presumably, you or the class. This is nice because it allows those watching a presentation to see not only the documents, spreadsheets, or PowerPoint/Keynote presentation but also the speaker's facial expressions, hand motions, etc. You get a better sense of what it might be like to watch such a presentation in real-life. What's more, we now have a dedicated space made for video capture so faculty at Emory no longer have to worry about getting a video camera taken to their classroom. The headaches saved by this feature alone probably make it worth thinking about using.
In order to test the system and think about its capabilities, I recently had the chance to record a med school lecture on the heart in the space. Even better, this last Friday I spent an afternoon filming my own presentation on--you guessed it--timelines. Essentially, I discuss the basic features of the interactive timelines I've been playing with this year and demonstrate how easy it is to add information to such a timeline within Google Docs. You can watch the presentation here.
Now, it just so happened that I recorded a presentation on timelines that was more or less identical to this one I made for my Timeline Tutorial using Camtasia. Having already made one presentation was helpful in the sense that I more or less knew what I wanted to say when I got put in front of a camera. More importantly, it gave me the chance to think about the relative advantages and disadvantages of both systems.
And there are plenty of disadvantages to the Accordent class capture system.
- In my mind, one of the main reasons to make a video recording of a class in which you use a presentation on a computer screen is to capture faithfully what you put on the screen. Unfortunately, because the Accordent only captures a smart board image once every second, the presentation side of things is not so much a video as a rapidly advancing slideshow. You can lose a lot of important information if you don't have a perfect capture of what's on the screen, as I learned in making the med school lecture, which used a PowerPoint presentation with a lot of movies. The value of watching the heart in action was lost as motion was eliminated. If a presenter is made aware of this limitation of the system, he or she can move the mouse and/or screen more slowly and compensate for this time delay. I think I actually did okay with this in my presentation, but there is a definite loss.
- Camtasia, on the other hand, captures exactly what is happening on the screen and does so at an adequate frame rate that the full motion of the mouse or videos your are displaying is preserved.
- The camera on the Accordent has a limited range in which it can recorded. This means that instead of calling it a "class capture" system, the Accordent should more properly be called a "lecturer capture" system. There are zoom and pan controls on the Crestron for the camera as well as 5 presets for the camera. But the range of the room that can be captured effectively is smaller than I would like. While recording myself, I had to mark where on the floor I could stand to be sure that I was within the camera frame. If someone else had been working with me, they could have used multiple camera angles. But the process for doing so is more complex than it should be: it requires watching a computer screen while simultaneously positioning the camera using the Crestron unit. Of course, the Crestron is touch-screen only so you have to look at it to use it. This results in shifting back and forth between two screens. Add to this the fact that the camera controls are on the herky-jerky side, and you have a situation in which the best production results from keeping the camera and the lecturer planted in one place.
- Of course, with Camtasia you are similarly rooted in one place if you want to record video of yourself as you're talking about what you're showing on a screen as you are dependent on a webcam.
- If you watch the Accordent presentation, you'll eventually notice that the volume of what I'm saying varies widely with where I'm looking. When recording the video for the med school, I had noticed that the lapel mic didn't have a very large range. I tried to compensate for this in my own production and positioned the mic so as to pick me up when I turn my head to look at the screen. Unfortunately, when I'm looking at the camera, the volume drops. More experimentation with the mic will likely help us iron out these problems.
- Still, in Camtasia I don't have to look away from the screen as I narrate what I'm talking about. This means that I can use a stationary mic and avoid similar problems.
- Another problem with the Accordent system is that it takes a very long time for it to start recording once you hit the "record" button. It makes sense: it has to start two different video feeds and an encoder. Still, it is always surprising how long it takes. It requires having another person give you the high sign when things are finally rolling. Otherwise, you end up missing the first 30-60 seconds of whatever has been said. If you are recording by yourself, you end up watching the Crestron and looking down for the first five seconds of the presentation.
- With Camtasia, on the other hand, when you hit "record" you are going immediately. Once you hit "stop," there's a bit of a lag as you wait for the encoding to wrap up. But it's nothing like the time required for the Accordent to wrap up its recording.
- So you've got a bit of dead space in the beginning of your Accordent presentation? Can't you just lop it off? Here's the real problem with our Accordent experience so far: a lack of editing tools. You have to do everything in one take. No trimming. No patching in a part where you misspoke. It's all or nothing. This isn't a radical oversight on the part of Accordent so much as it is due to the problems that would be involved in syncing the patched in/edited video with the smart board screen that has been recorded. When I was recording the medical lecture this was a real problem as a cell phone went off and we had to start a 20-minute segment over again. We've been told that there might be a tool we can buy from Accordent to edit our presentations. But since we've already spent tens of thousands of dollars on this tool, you'd think that this would come gratis.
- Of course, Camtasia is explicitly designed to allow you to edit your screencasts. You can go back and rerecord your audio commentary. You can cut in title screens (you'll notice that I had to use PowerPoint for titles in my Accordent presentation), and zoom to different parts of the screen. And because you can use a webcam in conjunction with recording the screen, you can also have a recording of the speaker (albeit, seated at computer) that plays simultaneously with what you have captured on the screen.
- A final difficulty with the Accordent system is that it outputs exclusively to Real formats. This means that it won't play nice with iTunes and iTunes U. You can--it appears--put either the video or the presentation video into iTunes U. But the simultaneous videos can only be seen on a computer.
Of course, the Accordent is a new tool. We're still trying to figure out how to best use it, what sorts of presentations play nice in the space, and how to get faculty and grad students to make use of it. Still, the gauntlet has been thrown and for the moment, I know which way I'm leaning.
Friday, May 16, 2008
Del.icio.us
I'm was a late comer to del.icio.us. The main reason being that I always found the site to be not that friendly for those who go to it for the first time. For starters, there's all that white space. I'm no design guru, but I find the site's layout to be a distraction because the visual hierarchy isn't quite what I expect it to be. After that, on my first visit to the site, I had a very hard time finding instructions on how to use the service. Perhaps I wasn't looking very hard as it's not all that difficult to find them. But I expected a site that is designed for social uses to be a little more friendly in getting me up and going. After all, they need my input to get the aggregated information that somehow (alchemically?) they turn into money. How hard would it be, del.icio.us, to make a screencast? I managed to do it.
But my quibbles aside, plenty of people seem to like del.icio.us. And I've been using it for two years. But recently Jason Jones did a blog post on del.icio.us that led me to poke into corners of the site that I hadn't even known were there. I'm most intrigued by the subscription and "links for you" features, especially since I can get both of them by RSS. Of course, in the case of the first, I still have to parse through the reams of information that comes cascading through teh interwubz. And in the case of the latter, I have to find people who want to send me links. I guess that's one of the downsides of social networking tools: if you don't have friends using the tools, then you don't get as much out of them as you might. I suppose I could start making friends on del.icio.us, but I certainly didn't go to grad school because I'm good at making friends. What's more, there's the whole problem of social network fatigue. I can only keep up with so many places. At the moment, that involves lala and its spinoff forums, some blogs that I follow, and Twitter.
In any case, read Jason's post if you want to have your ideas broadened about using del.icio.us. He even talks about using them in the classroom and has a del.icio.us assignment that you can pirate. I plan on using it this Fall in the sections of "Your Digital Life."
Tuesday, May 13, 2008
Timeline Tutorial is Finished!
File this one under "foot in mouth." Back on 28 February, I wrote that my tutorial on building your own timeline should be done within two weeks. Given my weekly readership numbers here on the blog, I don't have any reason to think that I have greatly disappointed anyone.
In any case, I'm pleased to report that I have finally finished writing my tutorial for building your own timeline using Exhibit and Google Docs. You can see it (and my semi-awesome screencast) here. My goal was to take things in a very step-by-step basis for faculty and grad students who are interested in using a timeline within their courses but don't have much (or any) knowledge of HTML. On the other hand, I wanted to give people the opportunity to build every part of the timeline themselves and understand the choices they were making.
I haven't yet finished the Advance Timeline Customization page, but hopefully everything else is there. I'd appreciate any feedback you may have.
I'm excited about this as it's one of the biggest projects I have tackled this year at ECIT. While there are some other tools out there for timelines, I continue to think that the flexibility of the Exhibit-powered timeline has advantages over the others. I'm excited to have the possibility of trying out timelines in some classes next year.
Monday, April 28, 2008
Timelines in Your Zotero Bibliography
I have previously written about Zotero. I like it very much as a bibliographic manager except for one thing: the fact that your collections are linked to a particular computer rather than shared across a network. I recognize that many people do most of their work from one computer and this isn't really a problem. I also know that exporting and importing citations into Zotero isn't hard. But since I work regularly from a laptop that is too ancient to have reliable Internet access as well as on a collection of different computers across campus and at home, Zotero hasn't proven to be as big a deal for me as I imagine it will be when version 2.0 comes out. This will allow you to not only access your collection from anywhere online but also to share your collections with others, create RSS feeds from them, and more. Until then, I'm going to stick with Endnote. (Yes, I recognize that EndNote doesn't play nice with sharing citations without a subscription to EndNote Web [I'm not even sure that Emory has a subscription].)
But here's what I'm interested in today: Zotero has added a SIMILE Timeline feature. You can read about it here. (Thanks, JBJ!) The timeline is fairly simple: it is designed to show you when the materials in your collection were either published (publication date), added (when you first added them to your Zotero collection), or modified (the date you last updated the entry). You can also highlight different items based on words in their title, filter entries by a keyword, just to a particular year on the timeline, or adjust the units of the three timeline bands.

The timeline appears in your browser, which is where Zotero lives. It does not at the moment, however, come with a stable URL which would allow you to share it with others. Instead, all the information (as is the case with all of Zotero) lives on your computer. Perhaps this will change when the new version of Zotero emerges and citations begin living on a web server rather than a small file on your hard drive.
Something else that I would like to see is the ability to highlight items based on terms beyond title words. At the moment, if I have a term in the "notes" field for a book, the book will not be highlighted when I use that term in one of the timeline's highlight boxes. Since terms that I associate with articles or books are not always (or even frequently) part of their title, the highlighting feature doesn't really serve the purpose that I think one would want for it: to show relationships between objects that are not immediately obvious.
Then again, one might ask whether having a timeline of your bibliography is the best place to reveal these relationships. Zotero has a "tag" feature, and if you've been diligent in assigning them, you can sort your collection within Zotero by those tags, without dealing with the timeline. A bigger question is about the whole implementation of a timeline in Zotero: does one really needs to visualize bibliographic data by date? I don't think that it's something that I will be using frequently. But then again, my work is not as date sensitive as that of people in the sciences or social sciences. My timeline works best when viewed by years and decades rather than months. Others would likely benefit from seeing how sources follow one another.
The larger benefit is something that I've been interested in throughout this year: the increasing ability to visualize data that is made possible by web 2.0 tools. I can't prove to you that having your bibliography in a timeline will lead to new ways to think about the sources or the datasets that they contain. But there's no reason to think that having this option wouldn't be of benefit. Just like Moretti's Graphs, Maps, Trees, you don't know what you can learn from a quantitative model (or quantitative-esque as far as Zotero goes) until you build it and spend some time looking at it. Perhaps if I added every source from Discourse Networks, I would learn something new about the shift in read/write technologies from 1800 to 1900. Or perhaps I could see where Kittler perhaps missed a crucial decade's worth of sources. In any case, something like the Zotero timeline is a tool to accomplish this.
P.S. As long as I'm passing along suggestions, it would be really amazing to see Zotero use SIMILE's Exhibit script in conjunction with Timeline, which would potentially allow the visualization of data to incorporate relationships between sources, their notes, tags, and more.
Thursday, April 24, 2008
Build Your Own Social Network
Despite my best efforts, I'm frequently behind the curve on web tools and platforms. Today I came across two different tools that essentially allow you to roll your own social network: ning and grou.ps. The idea is that rather than using a forum or wiki architecture, which are, respectively, either painful limited in what they can do or more complicated than the average user can handle, you have a WYSIWYG editor to compile your own Web 2.0 community.
To what extent are these something more than just a prettier forum? I'm not really sure yet. I'm thinking I'll have to play with these over the next few weeks. Anyone else want to play along?
To what extent are these something more than just a prettier forum? I'm not really sure yet. I'm thinking I'll have to play with these over the next few weeks. Anyone else want to play along?
Web 2.0 and Education
Wayne recently sent me a link to K-12 Technology Specialist Steve Hargadon's blog. A post at the beginning of March (sorry for being slow) suggests that Web 2.0 is the future of education. Hargadon is nothing if not effusive about his subject. Several commenters question the reality of his vision, in particular whether it will be possible to educate educators to make use of Web 2.0 tools when they are already busy and/or comfortable with their current levels of technology. I think they are right to make these observations, but let me just draw on two or three points of Hargadon's that I find interesting.
- Web 2.0 is primarily about publishing. Whereas the early web was oriented toward information delivery, the current iteration emphasizes the production of information by its participants. Create and remix are the orders of the day. We can take advantage of this by asking our students to participate in the assembly and creation of knowledge that is easily accessible to others. Students have in a sense always been creating, but publishing raises the stakes. (One of Hargadon's commentators correctly notes that the read/write opposition between Web 1.0 and 2.0 doesn't really hold because people were participating in email, chat rooms, etc. in the former. The difference, as I see it, is in the publishing of content so that third parties can read it.)
- The ease of publishing in a Web 2.0 environment means that we are faced with increasing amounts of information. Hargadon's proposed remedy?
...Produce more content. Because it is in the act of our becoming a creator that our relationship with content changes, and we become more engaged and more capable at the same time. In a world of overwhelming content, we must swim with the current.
This is a noble idea, but I'm not sure that it holds water. My writing this blog doesn't necessarily mean that I have a better idea of what information is out there. I extract things that I come across that are useful and share my observations on what I've been working on. But that doesn't help me manage everything I don't have time for. Perhaps what it does, however, is give me a place to articulate what I find to be valuable. Pointing it out to others. But does this all boil down to just another Digg-like application? Where things get filtered out by mass aggregation? That doesn't seem all that different from the systems we already have in place. - "The expert is giving way to the collaborator." I'm of the opinion that there will always be a need for experts. After all, having an expert teach you something is quite frequently the fastest means of information transfer. And at ECIT, we are all about best practices. But at the same time, I believe that collaboration will increase in importance within the classroom. And it won't just be the students collaborating with one another, but them doing so with the teacher/professor. It might look something like a class taught by Sander Gilman in Emory's ILA during the 2006-2007 school year, where the undergrads and grad students actually wrote a book:
The end product of the course will be a collaborative volume on the history of dieting which has been commissioned by a major publisher. This course will demand real research, real writing, and will have a real product.
The English Department has been making grants available to faculty members and grad students who want to co-author an article. Although these endeavors don't necessarily employ Web 2.0 technologies, they do capture the Web 2.0 mentality. What's more, they provide a possibile answer to the comments to Hargadon's original post who wonder how they can get teachers to learn new technologies: offer a concrete reward that has nothing to do with improving one's teaching.
Friday, April 18, 2008
A different approach to mapping
So although I've been dusting off my Google Earth skills a bit, this is going to go in a completely different direction. Last week, Shawn McCauley wrote about a new mindmapping tool--bubbl.us--on the English department blog. Mindmapping is perhaps a fancy way to say "outlining." But it's an exercise that many of us have used for our own work or taught to our classes as a way to begin a project. It can also be a useful brainstorming activity.
Shawn provides a good summary of the features of bubbl.us and also speculates on the classroom value of bubbl.us:
Finally, Shawn mentions two other mindmapping tools: Mindmeister and Mindomo as objects worth playing with if we were so inclined.
I hadn't previously played with mindmapping tools but checked out bubbl.us immediately as it seemed to be something more exciting than revising the dissertation chapter I was working on. Using bubbl.us proved so easy and fun that I began using it to collaborate with Rachel Bowser on a conference panel proposal we had been kicking around. After spending some time with bubbl.us, I decided that I would check out Mindmeister and Mindomo as well. In the past week, I've made several different mindmaps in each of the tools, and I think I have a good grasp on the advantages and disadvantages of each of them.
These are all useful tools that could be put to interesting use in the classroom, for group work, or for individual (student or professor) organization. They are all free (although two have subscription options) and are web-based so there is no need to install new software and your work is available wherever you can connect to the Internet. Generally speaking, Mindomo and Mindmeister are very similar to one another. They both organize materials in a tree structure. They're very orderly and allow you to collapse different elements of your tree to reduce the complexity of what you've built. And some of these maps can get very complex, as you can see from this mindmap of dermatology on Mindmeister made by Daniel Nygren. After playing with each of them extensively, I'd have to say that Mindomo is the definitely the more powerful of the two, but it also has a steeper learning curve. Mindmeister lacks some of the features of Mindomo, but the trade off might be worth it because its ease of use perhaps makes it more appropriate for the classroom. You can see example maps I made in both Mindomo and Mindmeister for people whom Rachel and I needed to contact about our call for papers.
bubbl.us is not as polished as the other two platforms, but there's a reason that I've spent most of my time with it. It's the easiest and the most fun of the three. Rather than using a tree structure, which is fairly rigid in how you can position different elements in relation to one another, bubbl.us allows you to position its topics and subtopics anywhere on the map that you'd like. There are some features missing from it that are really important, like the ability to add hyperlinks or images to your bubbles. But on the other hand, it appears to not even be in Beta yet--although still open to public use. It will be interesting to see where its development goes from here. (Note to Google: buy this site now!)
I could go on and on about the different advantages and disadvantages of the three different platforms (and you may think that I already have). But I've decided to use bubbl.us to summarize all of this for you.
If that's a bit small for you to be able to browse the information effectively--and I suspect that it will be, although the zoom buttons in the upper left corner can help--then you can browse a full-sized version here. Unfortunately, you can't drag the bubbles around or start making new connections between things on my map. So I'll just recommend that you sign up for a bubbl.us account (or one of the others, if you prefer their looks) and start playing.
Shawn provides a good summary of the features of bubbl.us and also speculates on the classroom value of bubbl.us:
I can see bubbl having a variety of pedagogical uses, both individually and collaboratively, both inside and outside the classroom. From teaching brainstorming in composition courses, to having students collaboratively trace the genealogy of the novel, to providing a graphic representation of intertexuality or patronage networks to accompany a lecture or in-class discussion, potential mapplications of bubbl abound.
Finally, Shawn mentions two other mindmapping tools: Mindmeister and Mindomo as objects worth playing with if we were so inclined.
I hadn't previously played with mindmapping tools but checked out bubbl.us immediately as it seemed to be something more exciting than revising the dissertation chapter I was working on. Using bubbl.us proved so easy and fun that I began using it to collaborate with Rachel Bowser on a conference panel proposal we had been kicking around. After spending some time with bubbl.us, I decided that I would check out Mindmeister and Mindomo as well. In the past week, I've made several different mindmaps in each of the tools, and I think I have a good grasp on the advantages and disadvantages of each of them.
These are all useful tools that could be put to interesting use in the classroom, for group work, or for individual (student or professor) organization. They are all free (although two have subscription options) and are web-based so there is no need to install new software and your work is available wherever you can connect to the Internet. Generally speaking, Mindomo and Mindmeister are very similar to one another. They both organize materials in a tree structure. They're very orderly and allow you to collapse different elements of your tree to reduce the complexity of what you've built. And some of these maps can get very complex, as you can see from this mindmap of dermatology on Mindmeister made by Daniel Nygren. After playing with each of them extensively, I'd have to say that Mindomo is the definitely the more powerful of the two, but it also has a steeper learning curve. Mindmeister lacks some of the features of Mindomo, but the trade off might be worth it because its ease of use perhaps makes it more appropriate for the classroom. You can see example maps I made in both Mindomo and Mindmeister for people whom Rachel and I needed to contact about our call for papers.
bubbl.us is not as polished as the other two platforms, but there's a reason that I've spent most of my time with it. It's the easiest and the most fun of the three. Rather than using a tree structure, which is fairly rigid in how you can position different elements in relation to one another, bubbl.us allows you to position its topics and subtopics anywhere on the map that you'd like. There are some features missing from it that are really important, like the ability to add hyperlinks or images to your bubbles. But on the other hand, it appears to not even be in Beta yet--although still open to public use. It will be interesting to see where its development goes from here. (Note to Google: buy this site now!)
I could go on and on about the different advantages and disadvantages of the three different platforms (and you may think that I already have). But I've decided to use bubbl.us to summarize all of this for you.
If that's a bit small for you to be able to browse the information effectively--and I suspect that it will be, although the zoom buttons in the upper left corner can help--then you can browse a full-sized version here. Unfortunately, you can't drag the bubbles around or start making new connections between things on my map. So I'll just recommend that you sign up for a bubbl.us account (or one of the others, if you prefer their looks) and start playing.
Friday, April 11, 2008
Apple takes a step backward
Last fall, when ECIT taught the Technology, Literacy, and Curriculum (TLC) workshop in conjunction with the English department, I was asked to conduct some assessments of the course. I wasn't surprised that all the participants had learned new things and that they anticipated using the various technologies and techniques we discussed in their upcoming courses. But what did surprise me was out of all the subjects we covered in 16+ hours, the one that students found most appealing was the demonstration on how to give presentations from their iPods.
This is an admittedly easy thing to do. Simply connect an Apple AV cable to your iPod and plug the other end into RCA connections on your TV.
 Then you can simply play a slide show or videos on the TV. No need to worry about PowerPoint or bringing a flash drive to class. (ECIT always recommends, by the way, that if possible you do bring a second copy of your presentation in a different format so you have a backup route for showing something.) You can now give a lecture with slides or video and not worry about any equipment besides your iPod, which most people always have with them.
Of course, Apple was tricky with their cables. They changed the wiring inside the iPod so that if you used a regular RCA cables that come with, say, your digital camera or that cost less than $5 at an electronics store it wouldn't output correctly. However, if you played around long enough, you could eventually discover that if you plugged the red cable into the yellow jack, the yellow cable into the white jack, and the white cable into the red jack, you had a working solution. Even if you didn't want to play around, Apple's cables, which had the right color scheme only cost $20.
All this changed last September, when Apple introduced the newest line of iPods: the Classic, Touch, and newest version of the Nano. Instead of outputting through the headphone jack with regular or Apple-branded RCA cables, to output your signal to TV all of these new iPods require you to have a cable or a dock with an Apple authentication chip. This chip is available in new cables that Apple has released and that plug, not into the headphone jack as on the 5th Generation iPod, but through the iPod dock connector. Importantly, the dock connector is, like the authentication chip, a design that Apple holds a patent on as opposed to headphone jacks. Okay, you say. That sounds less than ideal. How much will I have to pay for this magical iPod cable? Hear's the really egregious part: $50.
Perhaps this isn't news. In fact, ilounge.com, one iPod enthusiast website, covered this subject two days after the most recent iPods were announced. But I came up against this problem last week when teaching a class on iPods and enhanced podcasts for postdocs in Emory's FIRST program. We had some trouble getting the TV out to work in part because I wasn't aware that the postdocs' iPod Classics used differently technology than the previous generation.
One lesson to learn from this is to make sure you have tested all your technology before your class begins. It's never good to have the guy who is teaching you how to use an iPod be incapable of making it work. But the second lesson is that Apple has made it that much more difficult for us to use in the classroom what was the easiest and, according to the students, the best thing that we taught in TLC. Sure, I suppose you can say that we just need to go buy another cable. But the reality is that for graduate students $50 can be a significant cost. It's even significant if Emory or another institution is paying for the cables. Especially when one considers that 80 GB iPods cost $250, the purchase of the cable amounts to a 20% price increase in order to use an advertised feature of the iPod.
Apple's made a name for itself for being the company the makes products you go just plug in and start working with, and ECIT has touted iPods for being a tool you can just plug in and start teaching with. It's too bad that plugging in costs you an extra $50 now.
This is an admittedly easy thing to do. Simply connect an Apple AV cable to your iPod and plug the other end into RCA connections on your TV.
Then you can simply play a slide show or videos on the TV. No need to worry about PowerPoint or bringing a flash drive to class. (ECIT always recommends, by the way, that if possible you do bring a second copy of your presentation in a different format so you have a backup route for showing something.) You can now give a lecture with slides or video and not worry about any equipment besides your iPod, which most people always have with them.Of course, Apple was tricky with their cables. They changed the wiring inside the iPod so that if you used a regular RCA cables that come with, say, your digital camera or that cost less than $5 at an electronics store it wouldn't output correctly. However, if you played around long enough, you could eventually discover that if you plugged the red cable into the yellow jack, the yellow cable into the white jack, and the white cable into the red jack, you had a working solution. Even if you didn't want to play around, Apple's cables, which had the right color scheme only cost $20.
All this changed last September, when Apple introduced the newest line of iPods: the Classic, Touch, and newest version of the Nano. Instead of outputting through the headphone jack with regular or Apple-branded RCA cables, to output your signal to TV all of these new iPods require you to have a cable or a dock with an Apple authentication chip. This chip is available in new cables that Apple has released and that plug, not into the headphone jack as on the 5th Generation iPod, but through the iPod dock connector. Importantly, the dock connector is, like the authentication chip, a design that Apple holds a patent on as opposed to headphone jacks. Okay, you say. That sounds less than ideal. How much will I have to pay for this magical iPod cable? Hear's the really egregious part: $50.
Perhaps this isn't news. In fact, ilounge.com, one iPod enthusiast website, covered this subject two days after the most recent iPods were announced. But I came up against this problem last week when teaching a class on iPods and enhanced podcasts for postdocs in Emory's FIRST program. We had some trouble getting the TV out to work in part because I wasn't aware that the postdocs' iPod Classics used differently technology than the previous generation.
One lesson to learn from this is to make sure you have tested all your technology before your class begins. It's never good to have the guy who is teaching you how to use an iPod be incapable of making it work. But the second lesson is that Apple has made it that much more difficult for us to use in the classroom what was the easiest and, according to the students, the best thing that we taught in TLC. Sure, I suppose you can say that we just need to go buy another cable. But the reality is that for graduate students $50 can be a significant cost. It's even significant if Emory or another institution is paying for the cables. Especially when one considers that 80 GB iPods cost $250, the purchase of the cable amounts to a 20% price increase in order to use an advertised feature of the iPod.
Apple's made a name for itself for being the company the makes products you go just plug in and start working with, and ECIT has touted iPods for being a tool you can just plug in and start teaching with. It's too bad that plugging in costs you an extra $50 now.
Thursday, April 3, 2008
Google Timeline Gadget
I'm continuing to work on my tutorial for building your own timelines. I'm getting very close to having a final version of something I think can be useful for even those who have no experience writing HTML. If you've been following my work on this topic at all over the last six months or so, you'll know that I will suggest you host your data within a Google Docs spreadsheet. Well, a recent update to Google Docs may make the whole process even easier than that which I have come up with for the moment.
What's been added to spreadsheets is the ability to push your data through a "gadget." And one of those gadgets just happens to be a timeline gadget that is based on the Timeline code written by SIMILE. You can read about how to use the gadget here, but it is very simple:
There's just one problem...I haven't been able to get it to work. I keep getting an error message that suggests that I haven't titled all my columns correctly. After spending all this time working with Timeline and its scripts, however, I'm pretty sure that I've got that part right. I'm pursuing help with the powers that be to see if I can figure out how to get this working.
In any case, here's the part where I give you the positive and negatives to this approach and which will inevitably suggest that my chosen approach is particularly suited to what I want to achieve. On the plus side, it should be super easy to use. The gadget gets around your having to write an HTML side to a timeline. You can still share your spreadsheet with multiple people easily and thus have the database/wiki like feel to building and editing the timeline. Finally, the gadget includes an option that makes it easy to embed it in another web page or to include it in your iGoogle page. This means that you could build the timeline within a spreadsheet, but still place it within a page of your own design.
The disadvantages at the moment include the inability to customize the timeline as much as you might want to. You only have three units of time to pick from. You also cannot use more than two bands in your timeline. The events cannot be color coded by type of event. There is no search box nor can you restrict events by one aspect or another. And you can only use particular column headers at the moment. This means that the information you can include in your timeline is limited.
For these reason, I'm still a fan of the more robust timelines that I've been working with this year. That probably comes as no surprise to anyone. But there's at least one more option for you to use for now.
What's been added to spreadsheets is the ability to push your data through a "gadget." And one of those gadgets just happens to be a timeline gadget that is based on the Timeline code written by SIMILE. You can read about how to use the gadget here, but it is very simple:
- Set up your spreadsheet with the appropriately titled columns.
- Click on the gadget button that is in between the "Wrap text" and "Merge across" options.
- Scroll down and select "Timeline Gadget."
There's just one problem...I haven't been able to get it to work. I keep getting an error message that suggests that I haven't titled all my columns correctly. After spending all this time working with Timeline and its scripts, however, I'm pretty sure that I've got that part right. I'm pursuing help with the powers that be to see if I can figure out how to get this working.
In any case, here's the part where I give you the positive and negatives to this approach and which will inevitably suggest that my chosen approach is particularly suited to what I want to achieve. On the plus side, it should be super easy to use. The gadget gets around your having to write an HTML side to a timeline. You can still share your spreadsheet with multiple people easily and thus have the database/wiki like feel to building and editing the timeline. Finally, the gadget includes an option that makes it easy to embed it in another web page or to include it in your iGoogle page. This means that you could build the timeline within a spreadsheet, but still place it within a page of your own design.
The disadvantages at the moment include the inability to customize the timeline as much as you might want to. You only have three units of time to pick from. You also cannot use more than two bands in your timeline. The events cannot be color coded by type of event. There is no search box nor can you restrict events by one aspect or another. And you can only use particular column headers at the moment. This means that the information you can include in your timeline is limited.
For these reason, I'm still a fan of the more robust timelines that I've been working with this year. That probably comes as no surprise to anyone. But there's at least one more option for you to use for now.
Tuesday, March 25, 2008
Distributed fiction
So I've seen things like this before, but I've never had the chance to play with one as it is developing. A new distributed fiction by Toby Litt has gone live today. The basic plot is that a teenage daughter who has been getting into trouble in California is taken out of her environment by her parents who suddenly move to England. The house they're in may or may not be haunted. We'll get to find out as things go along.
You can follow the fiction by reading the blog of the daughter ("Slice") or of her parents. (Of course, the author have chosen age-appropriate domains for hosting the blog. You can also receive updates on Twitter (Slice and parents) and on Flickr. Finally, you can email Slice and interact with the characters that way.
This appears to be something that is coming out of a six-week project run by Penguin in the UK. You can read about this week's story here. And you can read the previous week's story here, which runs in Google Maps. Hey, I had nothing better to do for the next few days...
Credit to academicdave for pointing this out. Via Twitter. Of course.
Tuesday, March 18, 2008
Another academhack post on Twitter
academhack/Dave Parry has a new post up on his use of Twitter. In it, he addresses the two reasons he teaches Twitter. In the first place, he sees it as an emergent medium that is shaping how we communicate and, thus, shaping our culture. In the second place, as he has written previously, Twitter allows him to expand the learning community of his students beyond the walls of the classroom and throughout the day. Given the more nomadic lives of our students, knowing what one another is doing and thinking about is a way to bring more interactivity into the classroom to foster community/communal learning. He is persuasive and although I'm a member of the choir to whom he may be preaching, I believe he's correct on both points.
My own experience this past weekend using Twitter demonstrates the power of the smart mob/community that Twitter has put me in contact with. On Saturday afternoon, I learned from my wife that a tree had fallen on our house on Saturday afternoon in relation to the aftermath of Atlanta's tornado. I was waiting for Amber and the boys to come and pick me up at school, where I had spent most of the day when she called. Not having much to do, I decided to send out a tweet on the subject. Within a few hours, I had multiple people emailing to check on how our family was doing. Part of the distribution of the news was owed to my having integrated Twitter with Facebook. Some friends saw the tweet; others saw the updated Facebook status. But they more or less knew what was happening to me in real time. And they started offering to help in any way they could.
In returning to academhack's post, the one thing that I would really like to highlight is a point that he buries to a degree. He suggests that the networks between students and professors who are using Twitter is similar to the networks one has to learn to form in order to be successful in graduate school. In thinking back on my graduate school experience to this point, I think that Twitter could have made bridging the gap between myself and our department's faculty even easier. I understand why not everyone wants to spend their time Twittering or sharing their private lives with whatever grad students may want to listen in. But the chance to get to know faculty members outside of the seminar room and their office hours are equally rare and valuable. Twitter is a tool that allows us to readjust and strengthen these relationships.
And then to extend them laterally as we discover others who share our interests. When we don't all have travel/conference budgets to get out and meet all the people we would like to get to know, Twitter is a means for knowing what those whose work we are following in print are doing with their time. And it becomes the means to get to know them as well as or better than the people with whom you share an office wall.
Tuesday, March 11, 2008
Victorian Age Timeline being updated
Good news to you timeline fanatics out there. The Victorian Age Timeline that JBJ and I built for his Victorian survey class is beginning to be populated with data. Check it out. Send us accolades and money.
(In other news, my documentation on building your own timeline is nearing completion.)
(In other news, my documentation on building your own timeline is nearing completion.)
Tuesday, March 4, 2008
Who knew? Another timeline.
So, less than a week ago I wrote about Timefo as a timeline building alternative. A week before that, I covered xtimeline. And it was in that post that I wrote, in supreme confidence,
While I still don't think that building timelines will be all the rage, it appears that building tools to help others build timelines is.
Today, I came across TimelineIt. Like Timefo, it's based on SIMILE's Timeline script and uses a simple forms interface to allow you to add events to a timeline that you can scroll through.
Advantages of TimelineIt:
Timelines are not, I'm afraid, going to go viral in the near future.
While I still don't think that building timelines will be all the rage, it appears that building tools to help others build timelines is.
Today, I came across TimelineIt. Like Timefo, it's based on SIMILE's Timeline script and uses a simple forms interface to allow you to add events to a timeline that you can scroll through.
Advantages of TimelineIt:
- Dead-simple interface.
- Very smart inclusion of tabs that let you shift the scale of the timeline from days to weeks, months, or years. Zoom buttons let you get closer to events without changing the scale so radically. Look at the upper left and right, respectively, of this image, which is too large to host effectively on Blogger.
- You can use all the basic HTML coding that I use in my spreadsheets. This means you can use it to create italics or links within item descriptions or to host YouTube videos.
- A much better name than "Timefo."
- Lack of tags means that you can't group events into types or relate them in any way.
- No way to build timelines as a group.
- No way to "publish" timelines. I'm unable to show my timeline to others unless I pull it up for them while logged in to my account.
- Dead-simple interface means no explanation of how to use the tool or how to take advantage of HTMLing things.
- No photos or video (without already knowing how the Timeline script works).
- No mapping (which Timefo does very well).
Thursday, February 28, 2008
One More Easy Timeline Option
 All right. I'm well into my documentation for creating your own timeline. I hope that it will be finished, tested, and posted to the Internet within two weeks.
However, as luck would have it, I've come across another option for creating timelines. I don't have a lot of information about Timefo, and it's still in its Alpha phase, but it looks intriguing. It has an easy form for adding events (see graphic at right). It allows you to incorporate images or videos (it prefers YouTube and Flickr). You can also provide a location for each event and the timeline automatically maps it via Google Maps. There's a search feature that parses the timeline's text for particular terms. You can add labels (kind of like an Event type in my timelines) and tags (so you can link various events of different types/labels). You can also highlight particular types of events. (Timefo manages to do these things in part because it is making use of SIMILE's Timeline API.) Take a look at this timeline of 2008 San Francisco murders to get a sense of how it works. (The site works best with Firefox.)
I've put a quick timeline together and I generally like the results. There are a few drawbacks at the moment. For instance, there is not a way to build a timeline with a group. I assume (or at least hope) that Timefo is planning on implementing such an option. I also think that they could do a better job explaining the difference between tags and labels and the tags could be better implemented. At present, it doesn't seem like you can search among events based on tags. At least, I haven't been able to do this on my timeline. Finally, when you click on an event, you almost always have to scroll down to read it all. The event description and the timeline never seem to fit completely on the screen. And it's not like I'm using small screens or resolution here in ECIT.
I came across Timefo through a post its authors made to the SIMILE listserv in January. In it, they suggest a few things they have planned for the future. These include populating a timeline with RSS (one hopes that it continually updates, unlike xtimeline) or Google Spreadsheets. One proposed feature that I like is the option to share the events on your timeline. What that means is that others could remix your events into their own timeline. So they are thinking about mashing up their own data from the beginning. Very smart.
Right now, Timefo is not really ready for public use. For one thing, it's still not really accepting sign-ups. (FYI You can sign up using the link that I've provided.) And it's lack of group building tools means that at the moment it isn't what I've been looking for in a timeline. But that doesn't mean it can't become that in the future.
Monday, February 25, 2008
Twitter on the Chronicle
An article in today's Chronicle of Higher Education by Jeff Young examines the growing use of Twitter in academia. I was excited to see this article come out as I'd done a phone interview with the author regarding my recent blog post about Twitter. David Parry/academhack and Jason Jones both make appearances. Unfortunately, my comments seem to have not made the cut. I say unfortunate not only because my vanity can always use the boost, but also because what Jeff and I talked about was specific applications for how Twitter could be used in a classroom. To me, this is the real question: is it valuable for reaching an pedagogical goal? Nevertheless, the article is worth reading...especially since Jeff does a much better job at concisely explaining how Twitter works.
Thursday, February 21, 2008
Exhibit Tutorial
Just in case you are waiting with breathless anticipation for my instructions for creating your own timelines, you might want to check out Tom from Bionic Teaching's Tutorial on Exhibit. It was apparently written before Exhibit 2.0 was released, so there's a chance that it won't be perfect. Nevertheless, it's very good at walking you through what you need to do. I think the service my tutorial will provide will be to address at more length the different options in the timeline view.
A Kinder, Gentler Timeline (?)
So Alice Hickox of the Beck Center put me on the trail of a new piece of timeline software last week. xtimeline is a typical enough web 2.0 service that went live last summer. Predictably, it allows you to build timelines on any subject. The results are actually quite nice:
(The timeline actually looks a lot better if you look at it in its native environment, where the width and height aren't restricted.)
As you can see, you get scrolling. You get photos. And you can even embed video within the timelines. The interface for posting the events to the timeline are very straightforward: the basic sort of forms you would expect to see on such a website (or on my Google Forms Timeline).
 Each timeline can have multiple authors and can (obviously) be embedded in different websites or the blog of your choice. You can track the history of modifications made to events on your own timeline and revert back to a previous version of the event if something goes terribly awry. xtimeline also spaces events appropriately. What this means is that when there's a lot of events, the timeline shifts its units, as you see in the gap between Hemingway's birth and the next event. (You can do this same thing with Exhibit, but it's hard-ish.) Another advantage: you can upload photos directly to xtimeline, rather than having to use photos that are already hosted somewhere. This is a small thing but is important for making the process as simple as possible for those who don't know how or where to upload their own photos. All in all, I would have to say that the process of building a timeline on xtimeline is easier than it is when using Exhibit.
< aside >: Interestingly, xtimeline bills itself as a sort of social networking site. You can find other timelines to "like," make friends, and leave comments for each other timelines. Each timeline also comes with links so that you can embed the timelines wherever you want (as I've done above). In many ways, its interface resembles that of YouTube. But I don't really anticipate that this will be the next high-priced Google acquisition. I can understand the pedagogical purpose for timelines (you'd hope so at this point, huh?). And I can understand their value for news organizations and the like. And I can even understand that many people would have fun building something with a new tool. But I don't really think that people are going to be rabidly building and sharing these. Timelines are not, I'm afraid, going to go viral in the near future. < /aside >
However, for all the ease of xtimeline, there are some definite things that detract from the experience. The most important, in my book, is the process for building a timeline collaboratively. The best way to do this should be to start a "Group," have others join the Group, and in the language of an xtimeline blog post, "work together on creating timelines." The blog post indicates that the Group creator will have admin controls over every timeline in the Group. Furthermore, it says that the Group creator will be able to specify granular control over whether members can "modify all events (full cooperation) or only modify events they have created (limited cooperation)." Wow! That sounds great! It means that my students wouldn't be able to change each other's events or delete them on accident.
But it turns out that nothing in the Groups works the way it should. You cannot create a timeline within a group. Rather, you have to create one on your own and then post it to the group. Group members do not automatically get access to the timelines in the group to which they belong. What's more, I'm a Group creator (my group has one other user, the indomitable Erin Sells) and I have no controls over what the other Group members can do with the timelines (which is just as well, I suppose since they can't really edit them). I have been able to add Erin as an Editor to both of my experimental timelines. But I don't see the promised controls. And while it wasn't difficult to make her an Editor, it still took a step or two more than I would have liked. Using Exhibit, I know more or less who has control over the data (everyone, if you give them direct access to the spreadsheet; only me, if you use Google Forms).
That's the main problem. There are other problems with different xtimeline features. For instance, a very nice and easy way to start a timeline is with an RSS feed. I took the feed from this blog, put it in xtimeline and within 5 seconds, it spit out this timeline. But we all know that what is appealing about RSS is the way that it pushes events/information toward you. So what you'd expect from a timeline generated from an RSS feed would be that it would continue to get updated via RSS. That's not the case. You can go back and add more events via the RSS feed. But that gets a bit tiresome. (I wonder, however, what you could do if you ran a Yahoo! Pipe through xtimeline...). For the record, I think you could run a dynamic RSS feed through Exhibit, but I haven't tried to do this yet.
Some other advantages Exhibit has over xtimeline:
xtimeline is still perhaps the best solution for someone who doesn't yet have a mystical Exhibit tutorial to work from or who wants the easiest tool for creating a timeline. It's worth playing around with.
N.B. Inspired by xtimeiline's capabilities, I have just tested the Exhibit-based timelines I've been working with, and I'm pleased to report that I can embed video in them. (Granted, YouTube does the hard work with the hosting and the embedding codes.) For an example, go to the Google Forms Timeline and restrict the results to the "Video" event type. It does seem to be fickle depending on which browser you use, by the way.
(The timeline actually looks a lot better if you look at it in its native environment, where the width and height aren't restricted.)
As you can see, you get scrolling. You get photos. And you can even embed video within the timelines. The interface for posting the events to the timeline are very straightforward: the basic sort of forms you would expect to see on such a website (or on my Google Forms Timeline).
 Each timeline can have multiple authors and can (obviously) be embedded in different websites or the blog of your choice. You can track the history of modifications made to events on your own timeline and revert back to a previous version of the event if something goes terribly awry. xtimeline also spaces events appropriately. What this means is that when there's a lot of events, the timeline shifts its units, as you see in the gap between Hemingway's birth and the next event. (You can do this same thing with Exhibit, but it's hard-ish.) Another advantage: you can upload photos directly to xtimeline, rather than having to use photos that are already hosted somewhere. This is a small thing but is important for making the process as simple as possible for those who don't know how or where to upload their own photos. All in all, I would have to say that the process of building a timeline on xtimeline is easier than it is when using Exhibit.
< aside >: Interestingly, xtimeline bills itself as a sort of social networking site. You can find other timelines to "like," make friends, and leave comments for each other timelines. Each timeline also comes with links so that you can embed the timelines wherever you want (as I've done above). In many ways, its interface resembles that of YouTube. But I don't really anticipate that this will be the next high-priced Google acquisition. I can understand the pedagogical purpose for timelines (you'd hope so at this point, huh?). And I can understand their value for news organizations and the like. And I can even understand that many people would have fun building something with a new tool. But I don't really think that people are going to be rabidly building and sharing these. Timelines are not, I'm afraid, going to go viral in the near future. < /aside >
However, for all the ease of xtimeline, there are some definite things that detract from the experience. The most important, in my book, is the process for building a timeline collaboratively. The best way to do this should be to start a "Group," have others join the Group, and in the language of an xtimeline blog post, "work together on creating timelines." The blog post indicates that the Group creator will have admin controls over every timeline in the Group. Furthermore, it says that the Group creator will be able to specify granular control over whether members can "modify all events (full cooperation) or only modify events they have created (limited cooperation)." Wow! That sounds great! It means that my students wouldn't be able to change each other's events or delete them on accident.
But it turns out that nothing in the Groups works the way it should. You cannot create a timeline within a group. Rather, you have to create one on your own and then post it to the group. Group members do not automatically get access to the timelines in the group to which they belong. What's more, I'm a Group creator (my group has one other user, the indomitable Erin Sells) and I have no controls over what the other Group members can do with the timelines (which is just as well, I suppose since they can't really edit them). I have been able to add Erin as an Editor to both of my experimental timelines. But I don't see the promised controls. And while it wasn't difficult to make her an Editor, it still took a step or two more than I would have liked. Using Exhibit, I know more or less who has control over the data (everyone, if you give them direct access to the spreadsheet; only me, if you use Google Forms).
That's the main problem. There are other problems with different xtimeline features. For instance, a very nice and easy way to start a timeline is with an RSS feed. I took the feed from this blog, put it in xtimeline and within 5 seconds, it spit out this timeline. But we all know that what is appealing about RSS is the way that it pushes events/information toward you. So what you'd expect from a timeline generated from an RSS feed would be that it would continue to get updated via RSS. That's not the case. You can go back and add more events via the RSS feed. But that gets a bit tiresome. (I wonder, however, what you could do if you ran a Yahoo! Pipe through xtimeline...). For the record, I think you could run a dynamic RSS feed through Exhibit, but I haven't tried to do this yet.
Some other advantages Exhibit has over xtimeline:
- You can do text searches or display events from only particular categories within Exhibit. I've been unable to find something similar in xtimeline.
- You can host your timeline wherever you want.
- The above means that you don't get any ads, which are small but still there on xtimeline. Ads + educational tool=problem, in my mind.
- Exhibit can have multiple timeline bands. xtimeline gives you two. In reality, two is what you need most of the time, but as the Victorian Age Timeline demonstrates, it can be useful to have others. Plus you can grab and drag the different bands with Exhibit and they scroll at different rates. And we all like pretty.
- Because you are responsible for writing the HTML for your Exhibit (at least until I finish [or start] my documentation), you have much more control over what your timeline will look like. Of course, this involves knowing HTML and some CSS. But it turns out neither of those is that hard to pick up once you get going.
- Exhibit works very well to generate a timeline. But the timeline is only one possible facet. The other views, especially Google Maps, add several other ways to interact with and view your data. And these extra modes of visualization increase the learning possibilities for your students.
- Exhibit is open source. Thus, it has indie cred.
xtimeline is still perhaps the best solution for someone who doesn't yet have a mystical Exhibit tutorial to work from or who wants the easiest tool for creating a timeline. It's worth playing around with.
N.B. Inspired by xtimeiline's capabilities, I have just tested the Exhibit-based timelines I've been working with, and I'm pleased to report that I can embed video in them. (Granted, YouTube does the hard work with the hosting and the embedding codes.) For an example, go to the Google Forms Timeline and restrict the results to the "Video" event type. It does seem to be fickle depending on which browser you use, by the way.
Monday, February 18, 2008
Google Forms Timeline is Back! Hurrah!
Maybe I haven't found the secret button on Blogger that sets off flashing lights when one of my posts receives comments. As it is, I sometimes forget to check recent posts for comments. I'm glad that I did so today. A comment from Tom at Bionic Teaching regarding my Google Forms Timeline gave me the impetus to take a second look at it. (Plus, I finally have some time to do so.)
As I wrote previously, the Google Spreadsheet was forcing dates people entered with the form into a MM/DD/YYYY format rather than the YYYY-MM-DD format that Exhibit can read. Google Docs defaults to the former display mode for dates, but you can change the output for each column, and I had done so. I expected that doing so would correct the problem. The spreadsheet was showing the correct date format, but the timeline still wasn't showing the events that people had entered. I just figured something else was wrong.
But Tom's comment led me to check the Exhibit JSON on the timeline (the orange scissors you see when you hover your mouse over the timeline). And it turned out that even though I'd changed the formatting of the dates within the spreadsheet, they were still outputting incorrectly to Exhibit. I went back into the spreadsheet and changed the column formatting for the dates to plain text. And now that I've reentered the events, everything is suddenly working.
What I think this means is that although I was telling the spreadsheet to output the dates in a certain way that it nevertheless stores dates in MM/DD/YYYY format on its backend. It will change how it displays them to you, but as far as Google is concerned the data stays the same. And it obviously stayed in this default format when going out on the feed and consequently couldn't be read by Exhibit. Changing the columns to plain text will prevent the spreadsheet from cramming my data into a format that won't work.
What this means is that you can feel free to start adding events to the timeline. Try it out. I still believe, as I wrote in my first post, that there are some real reasons to give students access to the whole spreadsheet for creating a timeline. But this certainly presents another option.
Wednesday, February 13, 2008
Wikipedia and the New Digital Literacy
David Parry from academhack has a new editorial at Science Progress that advocates for the importance of digital literacy and uses the Wikipedia as a model. Good reading.
Tuesday, February 12, 2008
Oops.
Okay, this is a bit embarrassing. After posting both here on my blog and writing to the SIMILE listserv, it now appears that the Google Form Timeline is not functioning as it should. There have been at least three people who have used the form to add an event to the spreadsheet, but they are not being plotted on the timeline.
At first I thought that it had to do with the way the dates were formatted: the spreadsheet was forcing them into a format that Exhibit doesn't read. However, I've corrected that and I'm getting nothing, not even events that I've added subsequently added directly to the spreadsheet or via the form.
I tested this process with three different people this afternoon and didn't have any problems. Firebug isn't showing me anything wrong with the page. I'll work on hunting down what the problem might be tomorrow afternoon.
Thanks for the interest thus far.
Making Timelines Easier
So this post isn't an announcement that I have finished the documentation on rolling your own timeline. That's still a bit away. But last week, Google added a new functionality to its spreadsheets in Google Docs. You can read about it here. (Thanks go to JBJ for pointing it out to me.)
Basically, sharing a spreadsheet with other people in the past required them to sign up for a Google Docs account. In order to skirt this issue, Google has allowed you to create forms to generate the data within a spreadsheet. I've spent a little time playing around with this feature, wondering if I could get this to work with my timelines, which, as you know, are powered by Google Spreadsheets. The result is the Google Forms Timeline.
You can add an event (or 18) to the timeline by filling out the form. A link is provided on the timeline's page, but you can get there from here as well. You can see the actual spreadsheet here.
I see some decided advantages to using forms for populating the spreadsheet:
- In the first place, students don't have to interface with the actual spreadsheet. This is good because the spreadsheet isn't easy to understand in and of itself. There's no place for instructions within it as there is within a form.
- There is no chance that the students could do major damage to the spreadsheet (erasing large chunks, etc.) because they aren't allowed to touch it.
- Students don't have to sign up for a Google docs account. I'm guessing that most of them will have a Gmail account, but there will be a few Yahoo! reactionaries among them, I'm sure. To get around this, you can either send students the link or send the form to them within an email. They can actually fill out the form from within the email, which is pretty cool. (Warning, my testing shows that this function didn't work well with Hotmail.)
- If students make a mistake on the form, there is no way for them to correct it since they don't have access to the spreadsheet. They would have to email you, and you would have to log in and change things. This could happen repeatedly.
- More importantly, by not giving them access to the spreadsheet, it feels to me as if the entire process could become less collaborative. In other words, if students aren't interacting with the entire data set, it will feel less like a wiki and, maybe, even less dynamic. They can't repeatedly make small changes to their events and watch them update in real time on the timeline.
Monday, February 11, 2008
Twitterpated
It's common knowledge that you can tell how au courante a person is by the rate at which they adopt particular practices, objects, or technologies. I'm here to tell you that I downloaded the new Radiohead the morning it became available. But as far as my newest tool is concerned, I'm about as courante as a Commodore 64.
Within the past month, I've been playing with Twitter. Apparently Twitter was very, very cool last March. I never even heard of it until this January, which tells me that I haven't been reading enough articles in Wired. Or even the Wall Street Journal. But now that I know about it, you're going to know about it.
(Predictably, I came across a mention of Twitter when I was doing some reading related to timelines. A blogger who writes under the blog name kepo-ing Zz85 spent some time integrating Twitter with SIMILE's timeline. I haven't tried it for myself yet, but he left very detailed instructions on how to do it.)
Twitter is basically a platform for telling others what you are doing right at that moment. In other words, it works in a similar way to a person's status on Facebook. Like Facebook, you can view a person's status online and update your status online. One thing that differs about Twitter from Facebook, however, is that you don't have to log in to a platform to read about a person. Each Twitterer gets his or her own URL, where people can go to see the person's stream of updates. For instance, my url is twitter.com/briancroxall. You'll also notice that you can get an RSS feed from the page, so you could receive each of my "tweets" (what an individual Twitter post is called) in your RSS Reader of choice as they appear.
Once you have an account, you can watch what other people are doing on the public timeline. But where Twitter really excels is when you find friends that are also using the service. You can choose to "follow" another person on Twitter. What this means is that everytime that person updates his or her account, you receive their update on your timeline. In essence, this gives you real-time updates of what I'm doing. Yeah, I know: thrilling.
You can follow as many people as you like, which can result in a relatively noisy stream of information. Particularly idiosyncratic Twitterers have already become popular and mini celebrities. But there are also real celebrities using the service. Barack Obama and John Edwards, for example, have pages and each are being followed by more than 5000 people. What this means is that Twitter becomes an effective means for information dissemination from sources that you trust or from friends whom you want to know more about.
But let's take it one step further. And this is where Twitter differs from an application like Facebook. Twitter is cross-platform. What this means, is that while you can read and post to Twitter from its dedicated website, you can also do so using your mobile phone or your IM client. So, when I decide to go get pizza, I can text "Going to Fellini's" to Twitter (the number is 40404), and you will instantly get that update. What's more, you can choose to receive all of Twitter's updates not only on your Twitter account page or in your RSS reader but also on your mobile phone. So when I text Twitter, you'll get the update texted to your phone within a minute or so. See? Real time updating. The same principles apply when using Twitter from your IM. (An important caveat is that you have to pay text messaging charges on all updates sent to your mobile. So if you are following a lot of people, you could end up getting a lot of messages very quickly. Fortunately, you can turn off this feature. You can even schedule it to turn off at night, so you don't wake up to a lot of messages.)
The connection to mobile phones and SMS explains why you can only use 140 characters in Twitter posts. Text messages can only be about 160 characters, so Twitter allows you to have 140 of them. An added benefit of this restriction is perhaps the fact that you have to practice brevity in your writing. And, dear readers, you know that I can really use some brevity in my world.
Once you've set up your phone or IM to work with Twitter, you can use one more feature of the service, which is to "track" particular terms. If you send the phrase, "track ecit" to Twitter, then every tweet that goes through the system that contains the word "ecit" will be sent to your phone/IM, regardless of whether it originates with a person you are following or not. academhack writes about using this function during MLA to track the word "MLA" and thereby getting a sense of how Twitter was being used by conference participants and disgruntled partners/spouses who are annoyed to see their family members jet off right in the middle of the holidays. Tracking, by the way, only works with your cell phone or IM. You won't be able to track things online.
Okay, so now that we have covered how the service works, perhaps we can talk about how Twitter can be used in a classroom since that's what I'm most interested in with all these technologies. Why would you want to get your students using Twitter? Why do you want to know every banal detail about what is going on in their lives? And why would you want to get it sent to a mobile device rather than simply watching their Facebook profiles?
A good place to start thinking about these questions could be a Twitter assignment that academhack gave to a class last semester. The students had to follow his Tweets and had to sign up to follow other classmates. As the students began Twittering, academhack or academicdave, as he's known on Twitter, noticed that the result was that his class began to have conversations outside of class and that the students became more comfortable in discussion within the actual classroom. What happens, in short, is that the students developed a community and a sort of sixth sense as is discussed in the Wired article I linked above (and which I found via academhack's Twitter assignment). You can read academhack's thoughts about the assignment and about the larger implications for academia with Twitter on his blog post.
I have to credit this post for getting me to start thinking about the larger implications of Twitter for my own classrooms. Others have apparently felt this way, given the amount of attention that academhack's post has received in the Chronicle of Higher Education as well as other places. Getting to the table even faster than academhack is EDUCAUSE, whose July 2007 "7 Things You Should Know About..." document (pdf) examines Twitter in its academic setting. JBJ has recently suggested in an aside that he is using the service to reflect briefly on his teaching.
Here--at last--then, are a few more suggestions on my part for how one could use Twitter. One is to use a Twitter client like Twitbin on a projected screen while I'm lecturing. Since students will be more in listen/note-taking mode, they can use twitter to comment on what I'm saying, asking each other questions, etc. I could occasionally check the feed to see if they're following me (pun intended). This sort of meta-commentary could be distracting, but it could also provide a useful record of where I need to go back over concepts. At the same time, I could use Twitter as a free clicker/PRS system. It provides an easy way to ask a question and get students' answers readily available. Granted, you'd have to read through each answer rather than getting the answers totaled for you by software.
Another use for Twitter that parallels these two would be to use Twitter as a VERY abbreviated note-taking tool, which would allow a class to crowdsource the note-taking process. They could take notes on their laptops about what I'm saying. In their archive, they would have a collection of class content. If students are following each other, they could collectively generate a lot of notes all at once. The downside to this could be that it might be difficult to read through the notes that had been taken in this manner since you can only display so many tweets per page.
I'm hoping to think about other ways I could use Twitter in a classroom, and I'm hunting around the ol' internetz for any suggestions. Please feel free to suggest yours in the comments. There's a chance that this could be just a fad (that I'm radically late to) or not all that practical. Nevertheless, given the dispersion of mobile phones and the relatively high incidence of text messaging among our students, this seems to be a very effective tool for reaching our students on their own turf and for bringing the classroom a little closer to them.
Finally, here's a few fun things you can do with Twitter. Twittervision is a mashup with Google Maps that shows you where tweets are coming from in real time. The 3D view is a lot of fun. Twittervision's cousin, Flickrvision is even more fun, perhaps. The British blogger at OUseful Info has taken a similar approach and designed a Yahoo! Pipe and used it to geocode your tweets. Read about how you can use the Pipe here. What I like about this second application is that while Twittervision is a random representation of the sum total of Twitterers, you can use the Yahoo! Pipe to plot just your own tweets using the RSS feed from your Twitter home page. It depends on your using a place name in your tweets, however. So you'd want to be specific in what you say in order to develop an accurate representation of where you're twittering from. You can, of course, also integrate Twitter into Facebook.
And a last: Using Twitterfeed, you can have every blog post immediately broadcast as a tweet. Just...like...this.
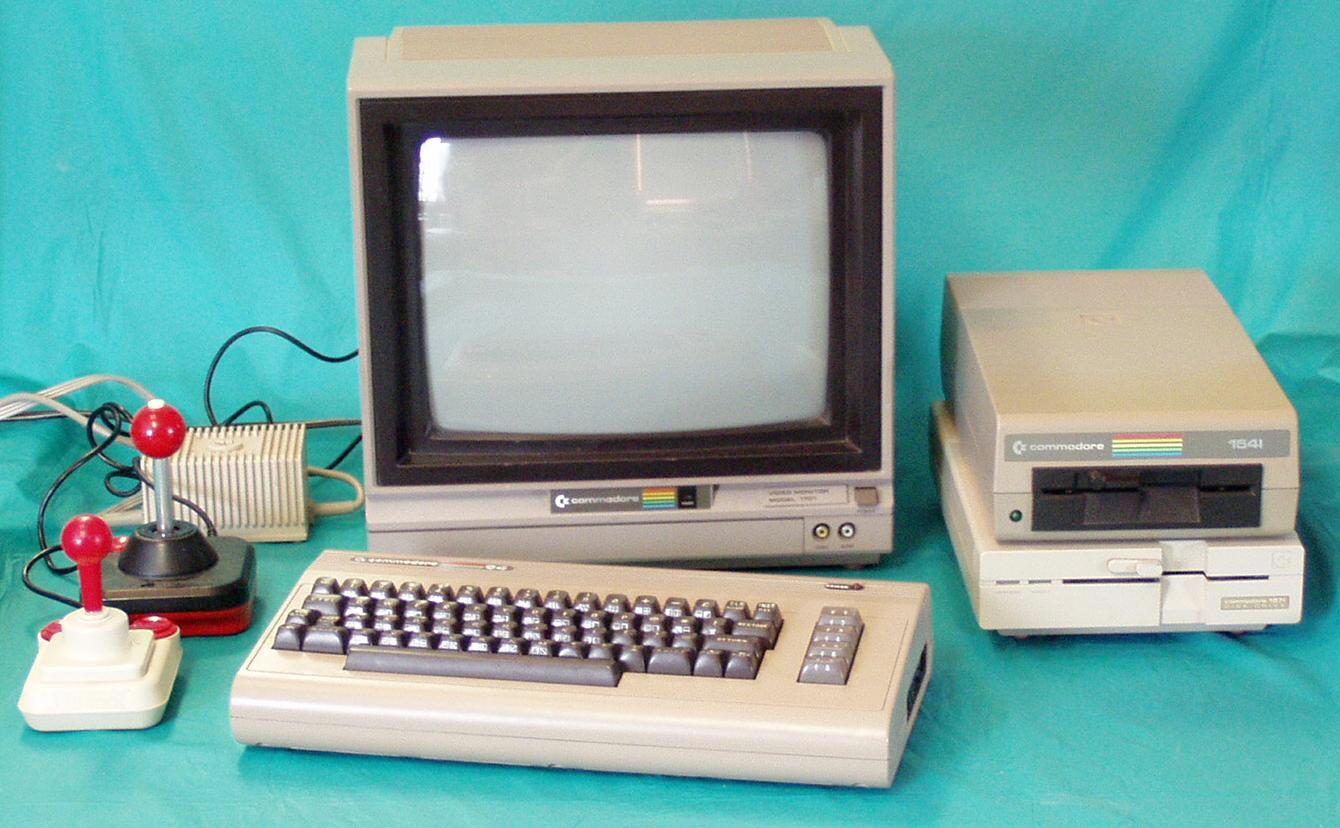
Tuesday, February 5, 2008
More on Timelines
Jason Jones has a new post on his blog about the Victorian Age Timeline that we collaborated on. He's much better at explaining what's compelling about using Exhibit for this work:
But what if you could do all that with image support, the ability to color-code and filter events by type, and the ability to locate events on a map? And what if that timeline could read data in a variety of formats–xml, json, and others? And, finally, what if that timeline could update itself in realtime from, for instance, a Google spreadsheet? Well, what you would have is the SIMILE Project's Timeline.Oh, and I guess that I might gain more Web 2.0 street cred if I were to refer to the collaborative project of populating the timeline as "crowdsourcing." I must remember this for my talk in April for the library.
Monday, February 4, 2008
CiteULike
I just read an article from last week's Chronicle about CiteULike. CiteULike more or less works like del.icio.us, but it is for academics to tag what they are reading recently. It doesn't appear to have as much functionality as Zotero, which I wrote about last September. But--unlike the current version of Zotero--it is a shared resource. Others can browse your articles and you can browse theirs. What's more, the site draws from Emory's sfx service, and therefore can link you more or less directly to the full text of an article if we have access through our library's databases.
Based on what each tool can currently do, CiteULike is a much more useful tool for research. It allows you to watch what others are reading and to take your references with you (because they're all online). Zotero has a better interface, in my opinion, and is more full featured. But until the next big release, it is tied to your local browser. And that's more or less what EndNote is.
I don't know that I'm going to start using CiteULike regularly. But that's got more to do with my not having internet access of my laptop than anything else.
(Cross-posted with the Emory English blog, to reach multiple audiences.)
Thursday, January 31, 2008
Google Bombing (Just because I haven't done anything on Google for a while)
You may remember two months ago when I wrote about trying to increase my Google footprint. The goal was to push this blog up a bit higher on the Google hit list, over and above the random scatterings of Amazon and other such sites.
I managed to erase the trace of my commercial practices. But the blog still comes in only at the eighth spot on the list. I'm still being beat out by my Writing Center profile from last year (why is that still online?), a piece of creative writing from my Bakhtin seminar, the Yahoo! Pipes that I built last semester (see this post), and several threads from the SIMILE listserv (where you can see what a realtive n00b I am with writing teh HTMLz). Sure, you eventually get my blog, but it's not quite what I'd hoped for.
And that's what you get with the regular Google button. What happens if you use the we're-oh-so-quirky-and-such-an-Internet-company-that-provides
-gyms-and-Aerons-to-all-its-employees-along-with-free-lunch-and-copious
-stock-options "I'm Feeling Lucky" button? Well, you get the top hit: my Writing Center profile. And this brings us to the process of Google bombing.
Google bombing is where a group of people work together to link particular sites and words to a third site. If enough people do this, then the results of a "I'm Feeling Lucky" search become skewed. A recent and well-known example of Google bombing happened in 2003, when searching on the phrase "miserable failure" took people to the White House's biography of George W. Bush. (In an interesting, somewhat meta-commentary on this process, doing the same "miserable failure" search today points to a BBC article that discusses Google bombing and this particular example.*) There are other popular Google bombing phrases, including "french military victories" and "more evil than Satan himself" which used to take you to Microsoft's home page but now (again with the meta?!*) takes you to a 1999 CNN article that discusses the "anomaly caused by quantum fluctuations in Web space".
Enter 2008 and a fascination with all things Chuck Norris (a favorite Internet meme along with lolcats and ninjas). Try using the "I'm Feeling Lucky" button with the phrase "find chuck norris." Amuse yourselves.
Among many things I find fascinating with this process, one is how it exposes the fiction in which Google acts as an arbitrator of collective intelligence (one topic in the just-released 2008 Horizon Report, more to come soon on this). We generally assume that Google's algorithm produces an unbiased glimpse of what the web has collectively determined is most relevant to a particular search phrase. Google enjoys its current leading position as a search engine precisely because it so consistently returns results that match what you and I are looking for that we tend to naturalize the relationship between algorithm and the masses of people whose work generates it.
The reality is that manipulating the search results doesn't require anything close to a hive mind. The BBC article linked above mentions that it took perhaps as few as 32 web pages to produce the Bush Google bomb. If you know the basics of the algorithm, then, you can produce results that have the patina of collective intelligence, but are really just the work of a few individuals.
This is one of the key issues in digital literacy. How do we teach our students (and ourselves) to recognize the difference between a Google bomb and a larger, collective decision to change the structure and semantics of the web more permanently? It's much harder doing seeing the difference with Google than it is with the Wikipedia, where you can at least see who the people are that edit the articles and know how often the changes have been made. The Google bomb becomes even harder to demystify because every link to it (including this blog) reinforces it.*
This mediascape is our world and the world of our students. We've got to learn to read it properly.
------
* Incidentally, Google initially had a policy of not halting Google bombs. As of 29 January 2007, however, they began to link the bomb phrases to sites that discussed the phenomenon of Google bombing, such as the BBC site above. For more information, see the Wikipedia. Or maybe type "Google bomb" and hit the button...
Wednesday, January 30, 2008
Department Directories 2.0
When I was going through the wonderful experience of the job market this past fall (score: 41 apps, 1 request for additional materials, 2 MLA interviews, 0 campus visits [thus far]), I spent a lot of time looking at department directories. You do this so you can get a sense of the department. You want to know how many other Americanists there are, how many people that do contemporary lit, how many people whose work you already know or should know. These are--apparently--important considerations when writing your cover letter and become even more important when you have interviews with schools. I say apparently because in practice my cover letters changed most frequently in response to the job ad. It was interesting exercise in fantasizing, however, to get a sense of who all these departments were and who my potential colleagues could be.
There seem to be two ways of creating online directories. There is the helpful version, of which Rutgers has an example. You get a page that lists people's names, but also where they received their Ph.D. and, most importantly, what their interests are. If you want to know more about a particular faculty member, you just click on his or her name and get a new page. There you get publication information, courses taught, etc. But the key here is that you can find out people's scholarly interests all on one page.
This one-page approach is what separates the helpful version from its counterpart: the we-want-you-to-click-a-lot (WWYTCAL) version. An example of this can, sadly, be found on the English department site here at Emory. Now, I can't deny that this page looks beautiful. It's certainly nicer looking than Rutgers's site. But the fact is that if I were trying to learn about Emory's faculty, I would have to open 43 separate pages (doing so is made much easier with the Snap Links add on for Firefox). I'd be sure to learn something interesting on each one, where all the same information as on Rutgers's site is present: publications, place of degree, courses taught, etc. But clicking through to each of these pages, multiplied by 26 other schools--my non-scientific data survey related to my job search indicates that 66% of departments go for the WWYTCAL version--is a LOT of pages to sift through.
Enter SIMILE (again) and its Exhibit javascript (again). Using these tools and a Google Spreadsheet (again), I've developed a dynamic department directory of the Emory graduate students. Not only can you see up front what people's interests and specialties are, but you can do a text search through the directory or use the attributes at the right to pull up what you want. Want to know all the people in the department who do 18th British lit? You've got it. Want to know who is interested in "Trauma Theory"? There you go. Want to know who does Caribbean lit and Victorian fiction? Alsjeblieft.
You'll notice that there are four different views on the page currently. The "Thumbnail" view in particular has not been polished and would look a lot better if it featured some photos of the grad students. But you get a sense of the different view options that have been built into the Exhibit code. My favorite is the "Hometowns" view, the data for which was initially provided by Shawn McCauley's post here. I like the map view because it gives a different sense of who we are as a department. If I had more time, I would go on and add a view to see where the grad students received their various degrees before coming to the Ph.D. program at Emory.
I've started work on a faculty directory for the department, but my attention is needed elsewhere in ECIT at the moment, so I'm not sure when I'll get back to that. And I'll be the first to admit that my grad student directory isn't as pretty as the one Emory currently has for its faculty. But I like to think that mine would fall into the "helpful" or perhaps even "very helpful" category.
Subscribe to:
Posts (Atom)